Q 1. Give reasons why following sentences are right or wrong:
(1) The main aim of distributional maps is to show location.
Ans. Wrong The main aim of distributional maps is to show distribution of variables like temperature, rainfall, population, etc. (1) Distribution maps are type of thematic maps. (2) These maps are prepared with special themes like distribution of various variables in a particular region. (3) Thus, the main aim of distributional maps is to show distribution of variables in a particular region.
(2) In choropleth maps, only one value is assigned to the sub-administrative unit.
Ans. Right (1) In choropleth maps, the data regarding various geographical variables is shown by shading or using tints of various colours. (2) After gathering the data for a selected variable, 5-7 classes are made considering smallest and the largest values. (3) Each class is assigned a tint of the same colour or black-and-white patterns. (4)Thus, in choropleth maps, only one value is assigned to sub administrative unit.
(3) In choropleth maps, colours/tints do not change according to the values of the variables.
Ans. Wrong. (1) In choropleth maps, colours/tints change according to the values of variables. (2) The smallest and the largest values of the given data of the variable are taken into consideration. (3) After that, 5-7 classes are made. (4) Each class is assigned a tint of the same colour or black-and-white patterns.
(4) Choropleth maps are used to show altitudes.
Ans. Wrong. Isopleth maps are used to show altitude. (1) When the distribution of a variable is continuous, the isopleth method is used to show its distribution. (2) For example, altitude, temperature, rainfall, etc.
(5) Isopleth maps are used to show population distribution.
Ans. Wrong. Dot method maps or choropleth method maps are used to show population distribution. (1) Distribution of a population is discontinuous. (2) Isopleth method maps are used to show the distribution of variables which are continuous. (3) For eg. altitude, temperature etc.
(6) In dot method, every dot should have an appropriate scale.
Ans. Right. The size of the dot is decided as per the value of a variable that is freely scattered across the region.
(7) Isopleth maps are not made using isolines.
Ans. Wrong. Isopleth maps are made using isolines. (1) When the distribution of a variable is continuous, the isolines are used. (2) Also When the distribution of a variable is continuous, the isopleth method is then used to show its distribution.
(8) Distribution of various geographical elements can be shown using dot method.
Ans. Wrong. Distribution of various geographical elements cannot be shown using dot method. (1) Distribution of geographical elements which are freely scattered across a region can be shown using a dot method. (2) Whereas the distribution of variables like rainfall, altitude, temperature etc. which are continuous, cannot be shown using a dot method map.
Q 2. Answer in brief
(1) Explain the use and types of distributional maps.
Ans.
Use of distributional maps: The distributional maps are useful for explaining the distribution of different variables like temperature, rainfall, etc. and patterns of distribution of a particular geographical variable.
The types of distributional maps :
Dot Method:The distributional map based on statistical data, made by this method, make use of dots of a pre-decided size to show the distribution of a particular variable, e.g. Dot method map is used to show population of a region, distribution of cattle etc.
Choropleth Method:The distributional map made by this method makes use of shades or tints of various colours, to show the distribution of a particular variable, e.g. Choropleth method map is used to show population density, types of forest cover, uses of land.
Isopleth Method:The distributional map made by this method makes use of lines joining locations or places having same or equal values of a particular variable, e.g. Isopleth method map is used to show altitude, temperature, rainfall.
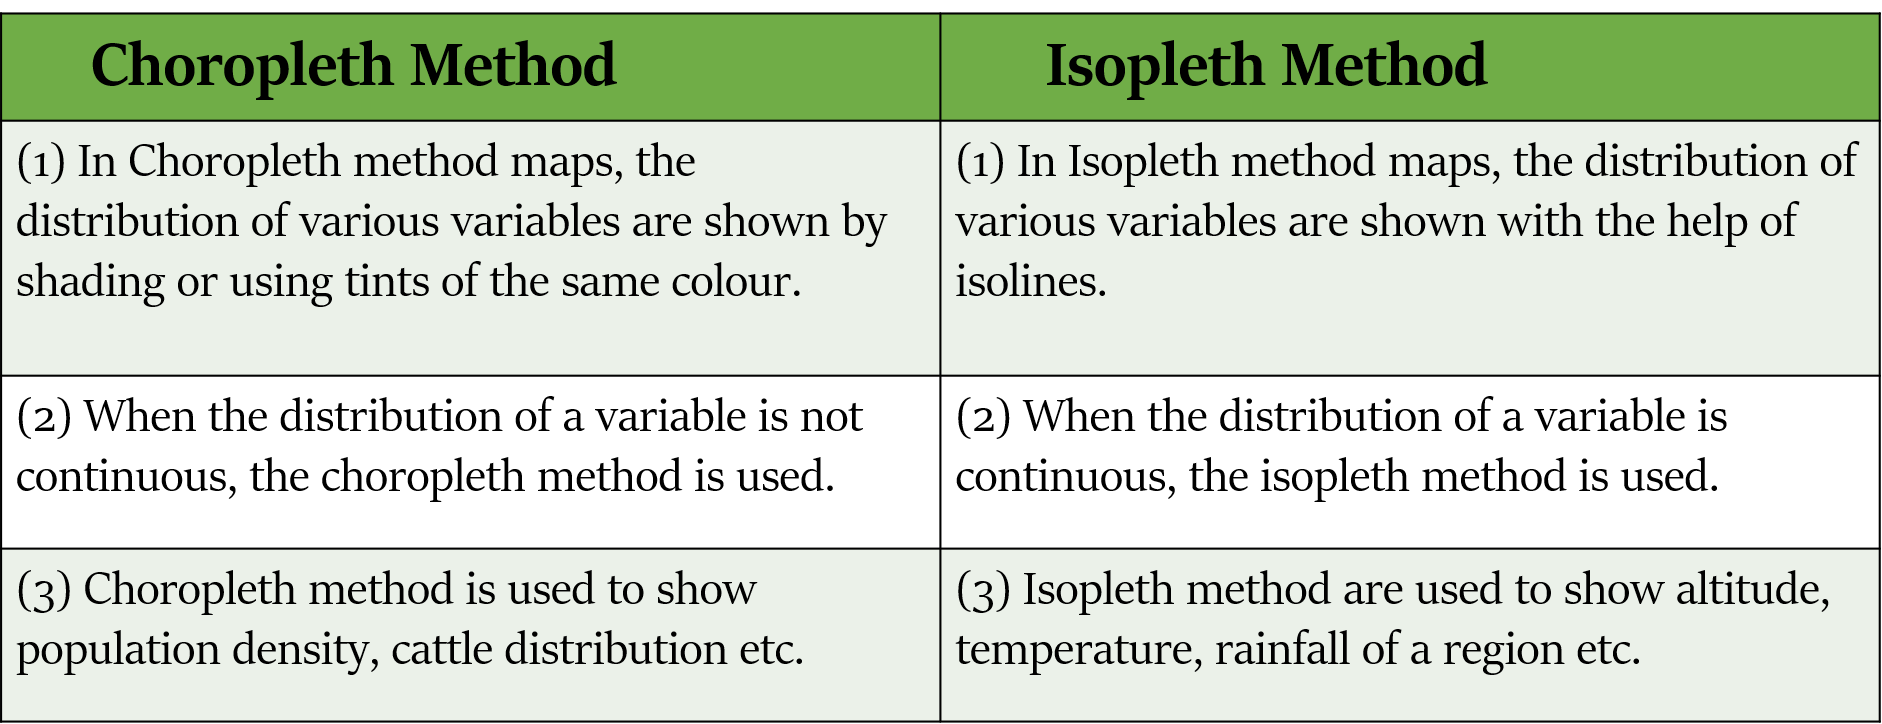
(2) Differentiate between choropleth and isopleths methods.
Ans.
(3) Explain with reasons the method which is best suited to show the distribution of population in a region.
Ans. (1) The dot method of making distributional map is best suited to show the distribution of population in a region. (2) The dots used in this method, are given a particular value which is determined by selecting a proper scale considering the spread of the values of the variables in the given region. (3) This method is best suited to show the distribution of the variables which are freely scattered as in the case of population distribution.
Q 3. Which method will you use for the following information ?
(1) Talukawise wheat production in the district
Ans. Dot Method
(2) Distribution of the altitude of the land in the district.
Ans. Isopleth method
(3) Distribution of domestic animals in the State
Ans. Dot Method
(4) The distribution of population density in India
Ans. Choropleth method
(5) Temperature distribution in Maharashtra State.
Ans. Isopleth method
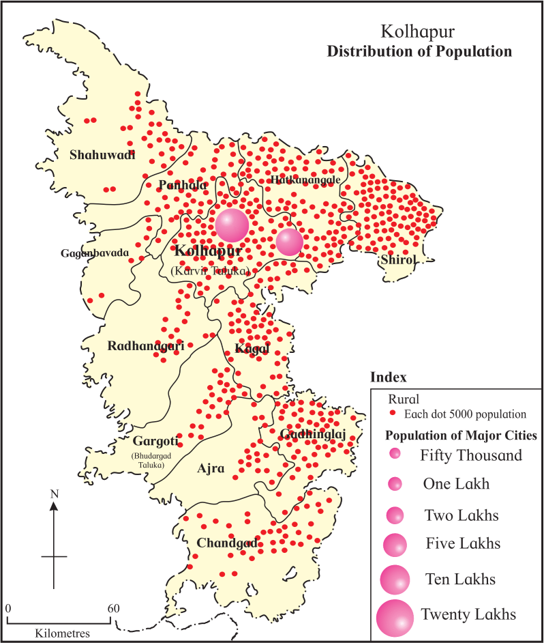
Q 4. Study the population distribution map of Kolhapur district and answer the following questions:
(1) Which method has been used to show the distribution of population in the district?
Ans. The dot method has been used to show the distribution of population in the district.
(2) Explain the direction wise distribution of population from dense to sparse.
Ans. The distribution of population is dense in the Eastern part of the district, whereas the western part of the district has low density of population.
(3) What is the population shown by the largest circle ? Which place is that?
Ans. The population shown by the largest circle is nearly 20 lakhs. That place is Kolhapur city (Karvir Taluka)
(4) Which Taluka has the least population?
Ans. The Gaganbavada Taluka has the least population.